Total fertility rate is the average number of children born to a woman in her reproductive age. This undoubtedly influences a community and their age structure/total population. Total fertility rate has been declining in recent years, although the TFR in developing countries remains higher than it in developed countries. It also remains higher than the replacement fertility rate of 2.1, which is the number used to describe how many kids one must have for a population to replace itself, but not grow, without immigration or emigration. The total fertility rate combines with external factors to determine population growth and decrease.

Infant Mortality Rate, Crude Rates
Infant mortality rate of the number of children that die before the age of one. This rate is especially high in developing countries due to lack of contraceptives, proper sex education, or adequate medical technology/planning. Crude birth rate is the number of births per 1000 people. Crude death rate is the number of deaths per 1000 people.
Emigration and Immigration
Other factors that influence the size of a country's population are emigration and immigration. Emigration refers to the number of people leaving the country which decreases a population size. Immigration is the number of people entering a country which will increase the population size. (Hint: Think- E stands for Exit.)
Frequently Asked Questions
What is total fertility rate and how is it calculated?
Total fertility rate (TFR) is the average number of children a woman would have over her lifetime if current age-specific birth rates stayed the same. It’s used to predict population change: if TFR ≈ replacement-level fertility (about 2.1 in developed countries), the population will be roughly stable. You calculate TFR by summing the age-specific fertility rates (ASFRs) for all reproductive age groups (usually 15–49) and multiplying by the width of each age interval (often 5 years). In formula form: TFR ≈ Σ(ASFR_age) × interval width. CED-aligned factors that change TFR include age at first birth, female education, access to family planning/contraception, infant mortality, and government fertility policies. For exam practice and quick review, see the Topic 3.7 study guide (https://library.fiveable.me/ap-environmental-science/unit-3/total-fertility-rate/study-guide/XA2EPXmkHOhfLa86fbEw), the Unit 3 overview (https://library.fiveable.me/ap-environmental-science/unit-3), and lots of practice questions (https://library.fiveable.me/practice/ap-environmental-science).
Why does the age when women have their first baby affect TFR?
If women start having kids at older ages, TFR usually falls because they have fewer potential childbearing years and shorter windows to have multiple births. Biologically, fertility and fecundity decline with age, so delaying first birth lowers the chance of larger completed family size. Social reasons link to this too: later first births often come with more education, career goals, and better access to family planning and contraception—all factors in the CED that reduce TFR (EK EIN-1.B.1). Government policies, cultural norms, and infant/maternal healthcare also interact with age at first birth to shape final fertility. On the AP, you might be asked to explain these causal links (EIN-1.B), so connect biology (reproductive span), socioeconomic drivers (education, urbanization), and access to contraception. For a focused review, see the Topic 3.7 study guide (https://library.fiveable.me/ap-environmental-science/unit-3/total-fertility-rate/study-guide/XA2EPXmkHOhfLa86fbEw) and practice questions (https://library.fiveable.me/practice/ap-environmental-science).
What's the difference between total fertility rate and birth rate?
Total fertility rate (TFR) and birth rate both measure how many babies are born, but they mean different things. TFR estimates the average number of children a woman would have over her lifetime based on current age-specific fertility rates—it’s a cohort-level measure that shows long-term reproductive behavior. Replacement-level fertility is about TFR ≈ 2.1 in most countries (if TFR is at replacement, the population is relatively stable per the CED). Birth rate (crude birth rate) is simpler: number of live births per 1,000 people in a year—a snapshot of annual births relative to population size. Why it matters for APES: TFR ties to factors in the CED like age at first birth, female education, family planning, and government policies (EK EIN-1.B.1). Birth rate is useful for short-term population change calculations on the exam, while TFR helps you discuss demographic transition and long-term stability (EK EIN-1.B.2). For quick review, see the Topic 3.7 study guide (https://library.fiveable.me/ap-environmental-science/unit-3/total-fertility-rate/study-guide/XA2EPXmkHOhfLa86fbEw) and more unit resources (https://library.fiveable.me/ap-environmental-science/unit-3).
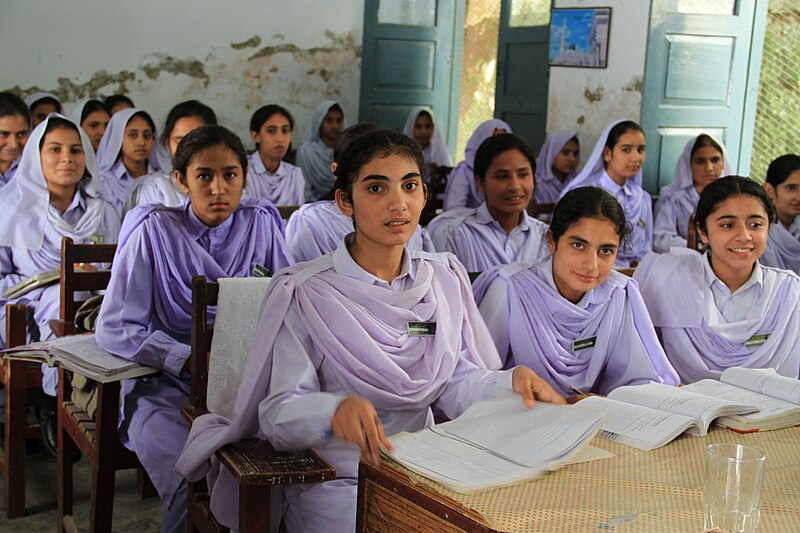
How does female education impact fertility rates in different countries?
Female education is one of the strongest predictors of lower total fertility rate (TFR). More schooling raises the age at first birth, increases career and economic opportunities, and improves knowledge and use of contraception and family planning—so women have fewer, better-spaced children. Educated mothers also access better maternal and child healthcare and nutrition, which lowers infant mortality; when child survival improves, families tend to choose fewer births. At population level this helps push countries through the demographic transition toward replacement-level fertility (~2.1 children/woman). Cultural and economic context matters: in low-income or rural settings the effect can be slower if access to contraception or jobs is limited. For AP exam topics, this connects directly to EK EIN-1.B.1 (female education, age at first birth, family planning). For a focused review, see the Topic 3.7 study guide (https://library.fiveable.me/ap-environmental-science/unit-3/total-fertility-rate/study-guide/XA2EPXmkHOhfLa86fbEw). More unit review and practice questions are at the Unit 3 page (https://library.fiveable.me/ap-environmental-science/unit-3) and practice bank (https://library.fiveable.me/practice/ap-environmental-science).
I'm confused about replacement level fertility - what does 2.1 TFR actually mean?
A TFR of 2.1 means that, on average, each woman has 2.1 children over her lifetime—just enough to “replace” herself and one partner in the population so size stays roughly stable (assuming no immigration or emigration). It’s slightly above 2.0 because some children die before reproductive age and because of sex ratios at birth. If a country’s TFR stays at ~2.1 and mortality rates don’t change, the population is considered near replacement-level (relatively stable). Remember: migration, changing infant mortality, or shifts in childbearing age can change whether 2.1 actually stabilizes population. Factors that push TFR down include later age at first birth, more female education, access to family planning/contraception, and government policies (CED EK EIN-1.B.1–B.3). For a quick AP-aligned review, see the Topic 3.7 study guide (https://library.fiveable.me/ap-environmental-science/unit-3/total-fertility-rate/study-guide/XA2EPXmkHOhfLa86fbEw) and try practice questions (https://library.fiveable.me/practice/ap-environmental-science).
Why do government policies like China's one-child policy affect total fertility rate?
Policies like China’s one-child rule directly lower total fertility rate (TFR) because they change the number of children families can legally have and alter social incentives around childbearing. Government limits reduce births per woman, shift the age and timing of childbearing (often toward earlier or delayed first births), and are usually tied to enforcement, fines, or access to benefits—all of which lower realized fertility (EK EIN-1.B.1). Policies can also increase use of family planning and contraception and encourage smaller family norms; over time they interact with female education, urbanization, and economic development to sustain lower TFR. Note possible side effects: skewed sex ratios, an aging population, and long-term demographic shifts (replacement-level concepts, EK EIN-1.B.2). For AP review, link this to the factors listed in the CED and check the Topic 3.7 study guide (https://library.fiveable.me/ap-environmental-science/unit-3/total-fertility-rate/study-guide/XA2EPXmkHOhfLa86fbEw). More unit review and practice problems are at (https://library.fiveable.me/ap-environmental-science/unit-3) and (https://library.fiveable.me/practice/ap-environmental-science).
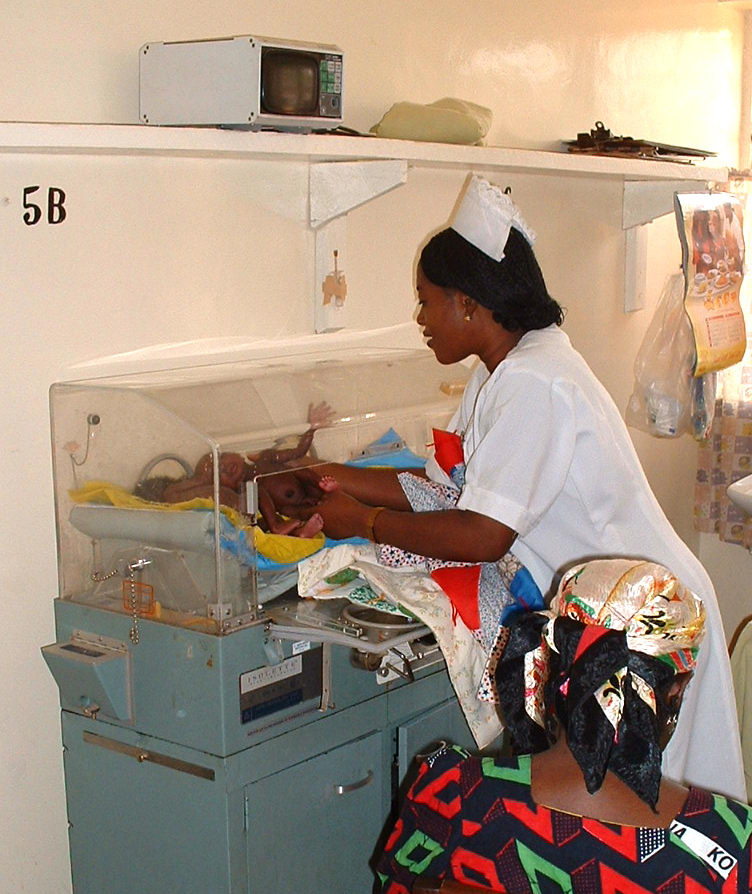
What factors cause high infant mortality rates in developing countries?
High infant mortality in developing countries is mainly driven by poor maternal and child healthcare (limited prenatal care, skilled birth attendants, and neonatal care), malnutrition for mothers and infants, and high rates of infectious disease from unsafe water, poor sanitation, and low immunization coverage. Poverty and weak healthcare infrastructure limit access to family planning and contraception, so births are often closely spaced and include adolescent pregnancies, which raise risk. Low female education also links to later first births and better child care—so where education is low, infant mortality tends to be higher. These factors raise infant mortality and, per the CED, help explain why TFR stays high: families often have more children to offset expected losses (EK EIN-1.B.1 and EK EIN-1.B.3). For review tied to the AP exam, see the Topic 3.7 study guide (https://library.fiveable.me/ap-environmental-science/unit-3/total-fertility-rate/study-guide/XA2EPXmkHOhfLa86fbEw) and Unit 3 overview (https://library.fiveable.me/ap-environmental-science/unit-3). For practice, try Fiveable’s practice problems (https://library.fiveable.me/practice/ap-environmental-science).
How does access to family planning and contraceptives change TFR?
Greater access to family planning and contraceptives tends to lower total fertility rate (TFR). When people can reliably prevent or space pregnancies, females often delay first birth and have fewer unintended pregnancies—both key drivers of lower TFR in the CED (EK EIN-1.B.1). Contraception also lets couples choose smaller desired family size, improves birth spacing (better maternal/infant health), and supports female education and workforce participation—factors tied to fertility decline in the demographic transition. Lower TFRs move populations toward replacement-level fertility (about 2.1 children per woman), producing more stable population growth. For AP exam study, connect this idea directly to EK EIN-1.B.1 and practice explaining how access to family planning interacts with age at first birth, female education, and infant/maternal healthcare. For more review, see the Topic 3.7 study guide (https://library.fiveable.me/ap-environmental-science/unit-3/total-fertility-rate/study-guide/XA2EPXmkHOhfLa86fbEw) and try practice problems (https://library.fiveable.me/practice/ap-environmental-science).
Why do developed countries usually have lower fertility rates than developing countries?
Developed countries usually have lower total fertility rates because of social, economic, and healthcare factors that the CED calls out. Women tend to have their first child later (higher age at first birth) and have greater educational and career opportunities, which lowers TFR. Widespread access to contraception and family planning lets couples control timing and number of births. Better maternal/infant healthcare and nutrition reduce infant mortality, so families don’t “replace” lost children. Urbanization, higher living costs, and different cultural norms also favor smaller families. Government policies (e.g., family-leave, childcare supports or lack thereof) and lower need for child labor in developed economies matter too. These are the exact factors listed in EK EIN-1.B.1 and tie into demographic transition and replacement-level fertility (~2.1 children). For a focused review, see the Topic 3.7 study guide (https://library.fiveable.me/ap-environmental-science/unit-3/total-fertility-rate/study-guide/XA2EPXmkHOhfLa86fbEw) and more unit resources (https://library.fiveable.me/ap-environmental-science/unit-3). Practice questions are at (https://library.fiveable.me/practice/ap-environmental-science).
What's the connection between healthcare access for mothers and infant mortality?
If mothers have good access to maternal healthcare and nutrition, infant mortality drops. Lower infant mortality changes family decisions: parents don’t need to have as many children to ensure some survive, so total fertility rate (TFR) tends to fall. Conversely, high infant mortality often keeps TFR high because families compensate by having more births. This links directly to AP CED ideas: maternal healthcare and child nutrition affect infant mortality (EK EIN-1.B.3), and changes in infant survival help drive fertility decline and demographic transition toward replacement-level fertility (~2.1 children per woman). On the exam, you might see this in questions about demographic transition, TFR drivers (female education, family planning, age at first birth) or graph/data interpretation. For a quick review, check the Topic 3.7 study guide (https://library.fiveable.me/ap-environmental-science/unit-3/total-fertility-rate/study-guide/XA2EPXmkHOhfLa86fbEw) and more unit resources (https://library.fiveable.me/ap-environmental-science/unit-3) or practice questions (https://library.fiveable.me/practice/ap-environmental-science).
How do cultural and religious factors influence total fertility rate?
Cultural and religious factors shape TFR by influencing when and how many children people want and can have. Norms valuing large families or male heirs raise desired family size and lower age at first birth; strict gender roles can limit female education and workforce participation, both linked to higher TFR (CED EK EIN-1.B.1). Beliefs about contraception or abortion reduce access/use of family planning, increasing TFR; conversely, cultures that accept contraception lower TFR. Religious teachings can affect breastfeeding practices and postpartum sex norms, which change birth spacing. Pronatalist cultural pressures or state policies tied to religion can boost TFR, while secularization and urban lifestyles tend to lower it. For AP exam links, explain these as social drivers of age at first birth, female education, and access to family planning (EIN-1.B). For more review, see the Topic 3.7 study guide (https://library.fiveable.me/ap-environmental-science/unit-3/total-fertility-rate/study-guide/XA2EPXmkHOhfLa86fbEw) and Unit 3 overview (https://library.fiveable.me/ap-environmental-science/unit-3).
I don't understand why better nutrition for mothers reduces infant mortality - can someone explain?
Better maternal nutrition lowers infant mortality because it directly improves fetal growth, birth outcomes, and newborn health. Well-nourished moms are less likely to have low-birth-weight (<2.5 kg) or preterm babies, which are major risk factors for infant death. Good nutrition also strengthens the mother's immune system and uterine environment, lowering chances of infection and pregnancy complications during delivery. After birth, better-nourished mothers are more likely to produce adequate breast milk and recover faster, which improves infant immunity and nutrition in the first critical months. Together with maternal healthcare, improved nutrition reduces infant mortality rates by cutting prematurity, low birth weight, and newborn infections—key factors the AP CED links to infant mortality and TFR (see topic study guide: https://library.fiveable.me/ap-environmental-science/unit-3/total-fertility-rate/study-guide/XA2EPXmkHOhfLa86fbEw). For extra practice on related Unit 3 concepts, check Fiveable practice questions (https://library.fiveable.me/practice/ap-environmental-science).
What happens to a country's population when TFR drops below replacement level?
If a country's TFR falls below replacement level (about 2.1 children per woman), its long-term population will tend to shrink unless offset by immigration. Decline isn’t immediate because of population momentum: a large cohort of young people can keep population growing for decades even with low TFR. Over time you’ll see an aging population, higher old-age dependency ratios, a smaller workforce, and potential strains on pensions, healthcare, and economic growth. Governments may respond with pronatalist policies, expanded family planning (to change timing/spacing), or encourage immigration to stabilize population. On the APES exam, connect this to EK EIN-1.B: TFR is affected by age at first birth, female education, access to family planning, and policies; EK EIN-1.B.2 notes that replacement-level fertility yields relative stability. For a quick topic review use the Topic 3.7 study guide (https://library.fiveable.me/ap-environmental-science/unit-3/total-fertility-rate/study-guide/XA2EPXmkHOhfLa86fbEw) and for broader Unit 3 review see (https://library.fiveable.me/ap-environmental-science/unit-3). Practice more population questions at (https://library.fiveable.me/practice/ap-environmental-science).
How does women's participation in the workforce affect fertility rates?
When more women work outside the home, total fertility rate (TFR) usually falls. Working women often delay their first birth and have fewer children overall—two big CED factors that lower TFR (age at first birth, female education). Employment is tied to higher education, better access to family planning/contraception, and urban living, all of which reduce desired family size. Economically, the opportunity cost of childbearing rises (lost wages, career momentum), so fertility tends to decline and can drop toward or below replacement (~2.1 children per woman). For the AP exam, link this to EK EIN-1.B.1 and demographic transition ideas in Unit 3. For a focused review, see the Topic 3.7 study guide (https://library.fiveable.me/ap-environmental-science/unit-3/total-fertility-rate/study-guide/XA2EPXmkHOhfLa86fbEw). For broader unit review or extra practice questions, check Unit 3 (https://library.fiveable.me/ap-environmental-science/unit-3) and practice problems (https://library.fiveable.me/practice/ap-environmental-science).
Why do some countries offer incentives for families to have more children?
Countries offer incentives (pronatalist policies) because falling total fertility rates (TFR) can create real social and economic problems. When TFR drops below replacement level, populations age and the working-age labor force shrinks, which raises costs for pensions, healthcare, and elder care and can slow economic growth. Incentives—tax breaks, child allowances, paid parental leave, subsidized childcare, housing benefits—encourage families to have children earlier or have more children, shifting the age-at-first-birth and boosting TFR toward replacement. Governments also respond to low birth rates to maintain national workforce size and long-term social stability. These policies can interact with female education, access to family planning, and cultural norms, so outcomes vary. For AP prep, connect this to EK EIN-1.B.1 (government policies affect TFR) and review the Topic 3.7 study guide (https://library.fiveable.me/ap-environmental-science/unit-3/total-fertility-rate/study-guide/XA2EPXmkHOhfLa86fbEw). For more practice on population topics, see Fiveable’s unit review and practice questions (https://library.fiveable.me/ap-environmental-science/unit-3; https://library.fiveable.me/practice/ap-environmental-science).